

Essential procurement KPIs measure savings, efficiency, and risk: achieved savings, managed spending, schedule compliance, procurement lead time, cost per order, supplier quality, and percentage of spend under contract are the most used.
What is not measured is not improved, and in procurement, measuring well makes the difference between an operational department and a strategic one. This is the list of key KPIs, with their formula, what they’re used for, and a reference benchmark.
What Is a Procurement KPI
A KPI (Key Performance Indicator) is a metric that reflects whether the procurement department is meeting its objectives for savings, efficiency, and risk control. A good dashboard combines result indicators (savings) with process indicators (timelines, cost per order).
Savings KPIs
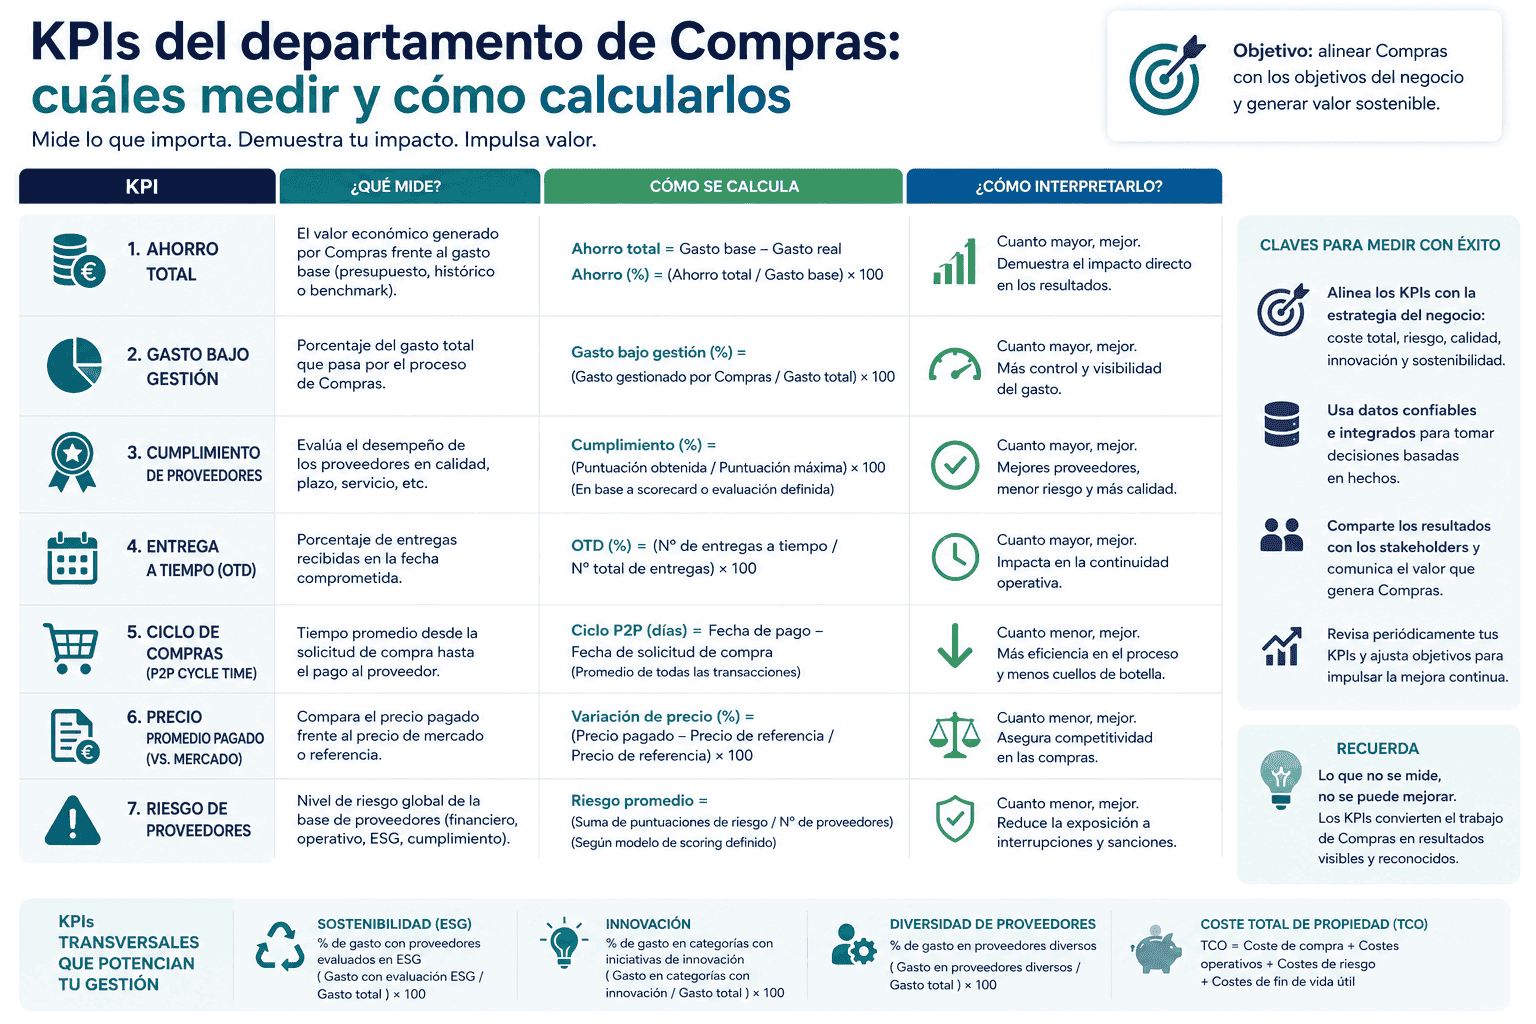
Savings Achieved (savings): measures the value generated by negotiation. Formula: (Previous Price − Negotiated Price) × Volume. A distinction is made between hard savings (reduces actual costs) and cost avoidance (avoided costs).
Managed Spending (spend under management): percentage of total spending that procurement actively controls. Formula: (Managed Spend / Total Spend) × 100. Benchmark: above 80% is a good maturity level.
Efficiency and Process KPIs
Procurement Lead Time: time from request to receipt. The shorter, the more agile the operation.
Cost per Order: administrative cost of processing an order. Formula: Total Process Cost / Number of Orders. Automation reduces it dramatically.
On-Time Delivery (OTD): percentage of on-time deliveries. Formula: (On-Time Deliveries / Total Deliveries) × 100.
Supplier and Risk KPIs
Supplier Quality: percentage of orders without incidents or defects. Supported by solid supplier classification.
Spending Under Contract: percentage of spending covered by formal contracts. Formula: (Contracted Spend / Total Spend) × 100. Reduces maverick buying and risk.
Summary table with formulas
| KPI | Formula | Indicative Benchmark |
|---|---|---|
| Managed Spending | Managed Spend / Total Spend × 100 | > 80% |
| Cost per Order | Process Cost / Number of Orders | The lower, the better |
| On-Time Deliveries (OTD) | On-Time Deliveries / Total × 100 | > 95% |
| Spending Under Contract | Contracted Spend / Total Spend × 100 | > 70% |
| Supplier Quality | Orders Without Incident / Total × 100 | > 98% |
Sustainability and Compliance KPIs
A fourth dimension has been added to the classic framework of savings, efficiency, and risk in recent years: sustainability. More and more departments measure the percentage of suppliers evaluated on ESG, the percentage of spending with certified suppliers, or the carbon footprint associated with purchases. These are not cosmetic metrics: regulatory pressure (CSDDD, sustainability reporting) makes them mandatory for many companies, and management requests them alongside savings. Including one or two ESG indicators in the dashboard connects procurement to the corporate sustainability agenda.
The Difference Between a KPI and a Vanity Metric
Not everything that can be counted deserves to be a KPI. A good indicator meets three conditions: it’s linked to a business objective, someone can act on it, and it’s measured reliably and consistently over time. The “number of orders processed” may seem like a KPI, but by itself it doesn’t say whether procurement is doing well; “cost per order” does, because it points to an action (automate). Before adding an indicator to your dashboard, it’s worth asking: if this number gets worse, will I know what to do? If the answer is no, it’s probably a vanity metric, not a KPI.
From Measurement to Improvement: The Cycle
Measurement is the beginning, not the end. Value appears when the KPI triggers action: falling spending under contract signals maverick buying that needs to be addressed; rising lead time points to a bottleneck in qualification or approval. This is why the dashboard should be reviewed on a fixed cadence—monthly for operational metrics, quarterly for strategic ones—and each deviation should have an owner and a plan. A beautiful dashboard that no one looks at improves nothing; a simple dashboard that’s reviewed and acted upon transforms the department.
How to Choose and Automate Their Monitoring
Don’t measure everything: choose between 6 and 10 KPIs aligned with your objectives and with real capacity to act on them. Automate their calculation with dashboards that feed directly from your procurement platform, so monitoring is continuous and not a manual end-of-month exercise. The new role of the procurement manager precisely involves managing with real-time data.
Frequently Asked Questions
What Are the Most Important Procurement KPIs?
Achieved savings, managed spending, cost per order, procurement lead time, on-time delivery compliance, supplier quality, and percentage of spending under contract.
How Is Savings Calculated in Procurement?
Hard savings is calculated as (Previous Price − Negotiated Price) × Volume. It’s complemented by cost avoidance, which measures avoided costs relative to a market benchmark.
What Is Managed Spending (Spend Under Management)?
It’s the percentage of total spending that the procurement department actively controls through processes, contracts, and negotiation. It’s calculated as Managed Spend / Total Spend × 100, and above 80% indicates maturity.
Automate Your Procurement KPIs in Real-Time Dashboards. Discover It on the itbid Platform.